Data Visualization Services

Transform Your Data into Powerful Visual Stories

At Splenden, we specialize in turning complex data into engaging, interactive visual experiences that drive insights and decision-making. Data is the backbone of every business — but without clarity, it’s just noise. Our Data Visualization Services help you uncover hidden trends, spot opportunities, and communicate results with precision. We design charts, dashboards, infographics, and real-time analytics tools tailored to your goals.
Whether it’s for internal reporting, client presentations, or product interfaces — we craft visuals that speak louder than numbers.
From startups to enterprises, our solutions scale across teams and departments. We bridge the gap between raw data and strategic decisions.

Our Data Visualization Services

Custom Dashboard Development

We design intuitive dashboards that align with your KPIs and business goals. Track performance metrics, customer behavior, and operational efficiency in one place. Built with real-time updates and interactive elements for deeper analysis.

Interactive Reports & Analytics

Our interactive reports turn static data into actionable stories.Users can filter, sort, and explore data through visual components.
Ideal for board meetings, performance reviews, and marketing analytics.

Infographics & Data Storytelling

We craft compelling infographics for marketing, branding, or awareness campaigns. Combining creativity with clarity, we transform numbers into visual narratives. Perfect for social media, blog content, and investor decks.

Geospatial & Map Visualizations

Plot your data on maps to reveal location-based insights. Ideal for logistics, real estate, delivery tracking, and field sales performance. We support heatmaps, clustering, choropleths, and more.

Real-Time Data Dashboards

We build dynamic dashboards that update with live data streams. Ideal for monitoring operations, trading platforms, or IoT devices.
Get instant alerts and visual cues for abnormal activity.

Embedded Data Visualizations

Add rich visual analytics directly into your product or website.Seamlessly integrate charts, graphs, and reports into SaaS tools. Custom styling to match your brand and UX flow.

Benefits of data visualization services

Faster Decision-Making

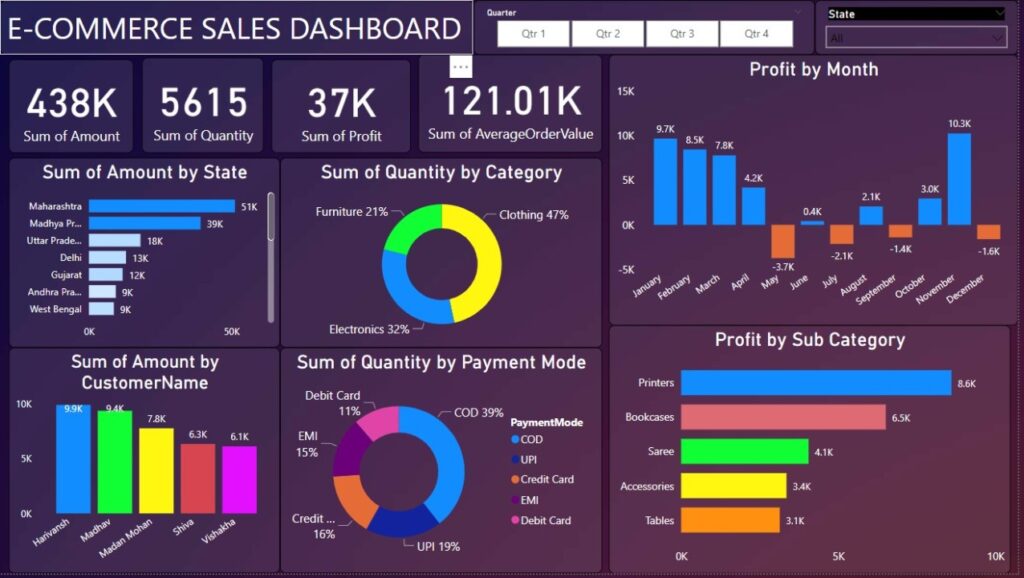
Visual dashboards simplify data interpretation, allowing your teams to act quickly and confidently.

Improved Communication

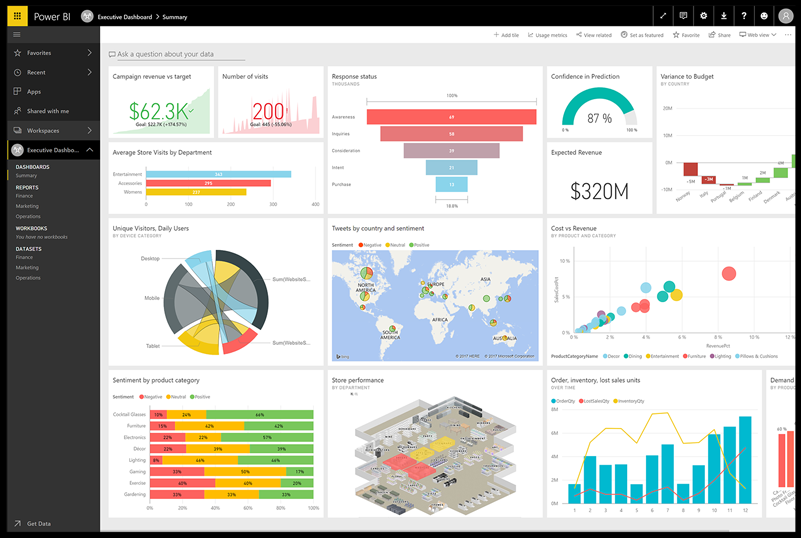
Clear visuals make it easier to share insights across departments, clients, or executives with less confusion.

Data-Driven Culture

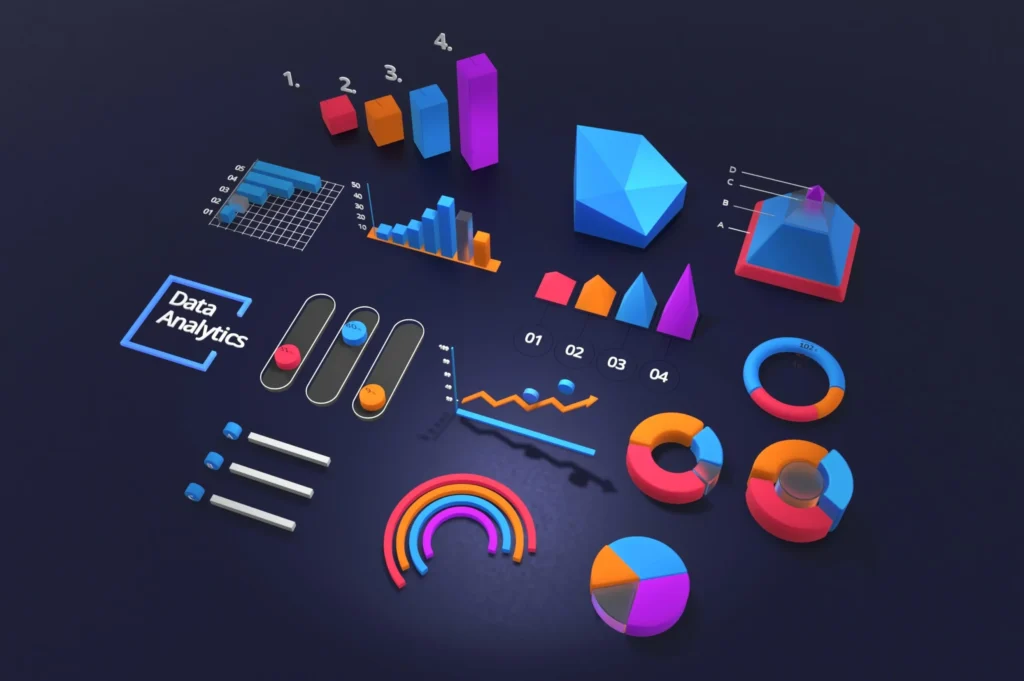
Empower your organization to embrace analytics and make strategic decisions backed by evidence.

Industry Pain Points

Scattered and Siloed Data

We unify your data sources into a centralized visual platform for complete clarity.

Scattered and Siloed Data

We unify your data sources into a centralized visual platform for complete clarity.

Overwhelming Raw Data

We turn cluttered spreadsheets and large datasets into clean, consumable visualizations

Overwhelming Raw Data

We turn cluttered spreadsheets and large datasets into clean, consumable visualizations

Lack of Engagement with Reports

Static reports are often ignored — our interactive designs boost user attention and retention

Lack of Engagement with Reports

Static reports are often ignored — our interactive designs boost user attention and retention

Case Studies

Retail Sales Dashboard for E-commerce Brand

Retail Sales Dashboard for E-commerce Brand

Geospatial Visualization for Logistics Firm